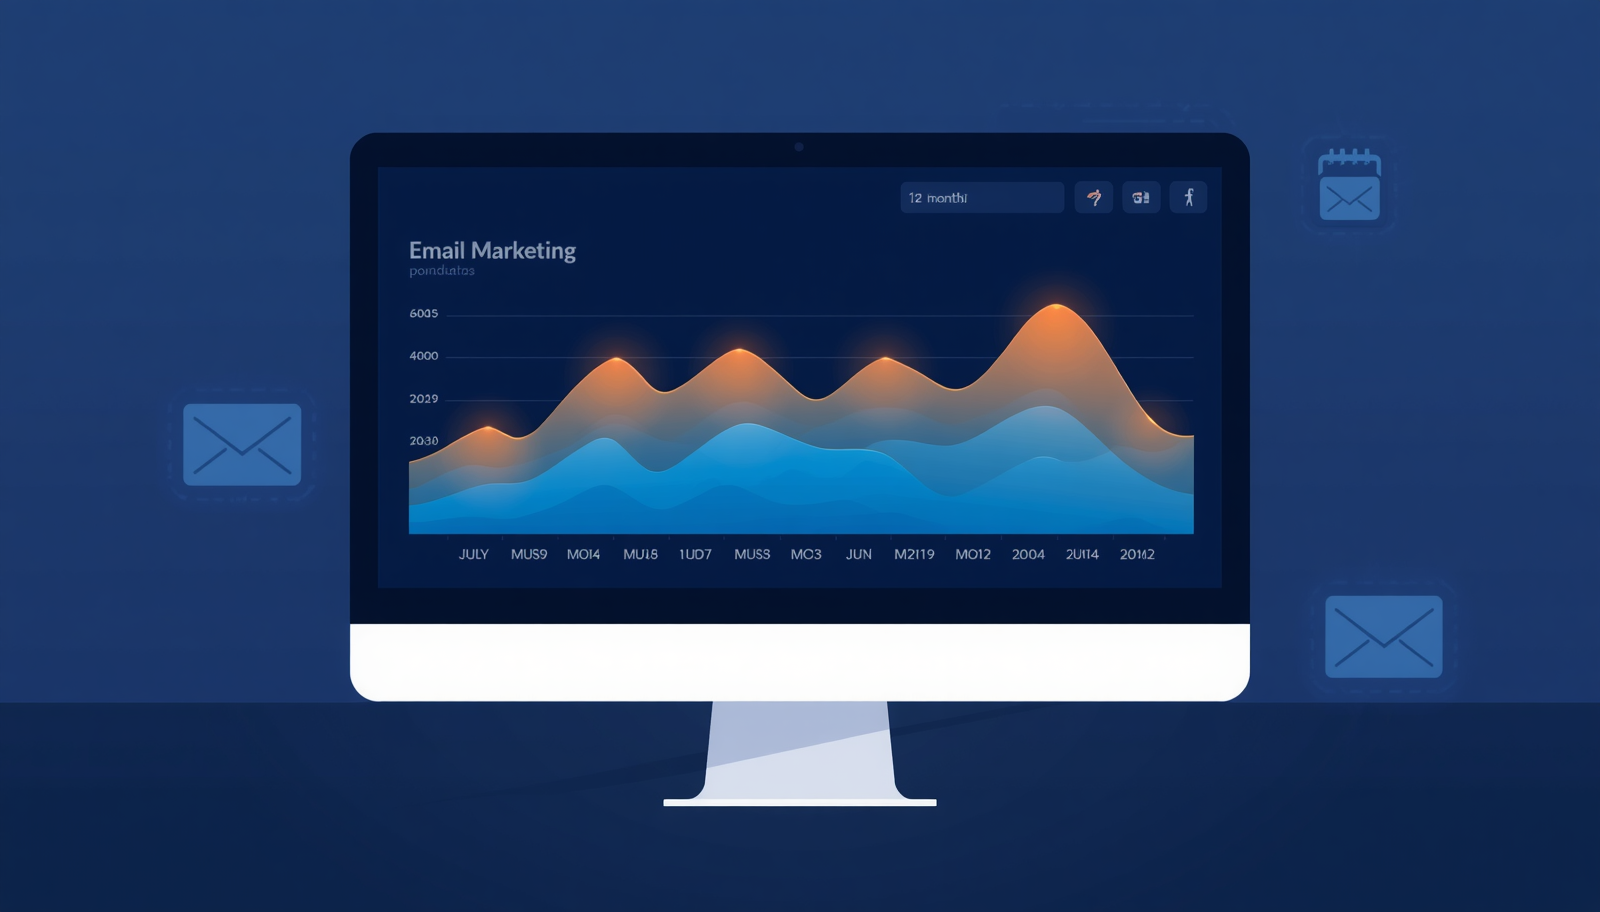
Every email marketer has been there. Open rates drop. Click-throughs go quiet. Revenue slows. And the first instinct is to ask: what did we break? So you start testing new subject lines, tweaking templates, reshuffling your segments — and nothing works. Weeks pass. You've changed everything, and you still can't figure out why performance is down.
Here's the uncomfortable truth: sometimes, nothing is broken. The season just changed. And if you don't know what your data looks like across a full year, you'll spend your slow months dismantling a strategy that was actually working fine.
Seasonality Is Real — and Most Brands Ignore It
Seasonality affects virtually every email program, regardless of industry. Consumer behavior shifts with the calendar — buying intent, inbox attention, and emotional state all fluctuate throughout the year. Some periods are naturally high-energy (holiday shopping, back-to-school, New Year), while others are quiet by nature (mid-January slump, summer lulls for some niches).
- Naturally strong seasons: Q4 holidays, Valentine's Day, Mother's Day, major sale events.
- Naturally weak seasons: Post-holiday January, mid-summer doldrums, certain regional and cultural slow periods.
- Niche-specific seasons: Fitness brands spike in January; back-to-school brands peak in August; B2B brands often dip in December.
None of this is random. These patterns repeat year after year — but only become visible when you actually look at the data across time.
The Danger of Not Knowing
When a marketer doesn't understand their seasonal baseline, a natural performance dip looks like a failure. And that triggers a chain reaction that can be very hard to undo.
- Unnecessary changes: Subject line formulas get scrapped. Send times get shifted. Templates get redesigned — all because of a dip that had nothing to do with those elements.
- Compounding variables: Each change adds a new unknown. After five untested changes in a row, you can no longer tell what's working or what made things worse.
- List damage: Panic-sending to your full list during a low-engagement period drives up unsubscribes and spam complaints — the very signals that hurt your long-term deliverability.
- False credit: When the season naturally recovers, the last change made gets credited for the "turnaround" — reinforcing the wrong lesson.
The result is a program that's harder to manage, harder to trust, and harder to grow — all because of a problem that was never really there.
The Right Question to Ask
When performance dips, most marketers ask: "What did we do wrong this month?" The better question is: "What did this same period look like last year?"
A 25% drop in open rate from December to January is alarming — unless January always drops 25% from December, in which case you're right on track. Without year-over-year context, every data point is misleading. Month-over-month comparisons alone are not enough to make strategic decisions.
📅 Pro Tip
Always compare the same period year-over-year — not just month-over-month. If January this year is performing at the same level as January last year, your program is healthy. Beat last January, not last December.
How to Use Seasonality to Your Advantage
Once you understand your seasonal patterns, you stop fighting the calendar and start working with it. Here's how smart email marketers use seasonal awareness:
- Protect your list during slow periods: Don't aggressively blast your full list during naturally low-engagement windows. Send smarter, not harder — focus on your most engaged segments.
- Run experiments in weak seasons: Low-traffic periods are actually ideal for testing. Lower stakes, more contained results, and any wins carry forward into strong seasons.
- Prepare for strong seasons in advance: Use quiet periods to clean your list, build new segments, warm up sender reputation, and pre-schedule flows. When the peak arrives, you're ready.
- Set honest internal expectations: Share your seasonal calendar with stakeholders so no one panics during predictable dips — or demands risky interventions at the worst possible time.
Building Your Seasonal Performance Calendar
The most practical thing you can do is build a 12-month baseline using your own historical data. Pull your key metrics — open rate, click rate, revenue, unsubscribe rate — for every week or month over the past two years. Then map the patterns.
- Identify your strong weeks: Mark periods where performance consistently exceeds your annual average.
- Identify your weak windows: Note the periods that reliably underperform — these are your "don't panic" zones.
- Note any anomalies: One-off spikes or drops that don't repeat are not seasonal — they were caused by something specific.
- Update it every year: Seasonality can shift slightly over time as your audience and market evolve.
This calendar becomes your single most important reference document. Before making any strategic change, check it first.
Seasonality Doesn't Mean Giving Up
Understanding that a season is weak doesn't mean accepting poor performance — it means setting the right benchmark and using the period wisely. There's still plenty you can do during slow seasons: deepen relationships with your existing subscribers, test content formats, refine automations, and lay the groundwork for your next peak. The goal is to come out of every slow season in a stronger position than you entered it.
The brands that grow consistently aren't the ones who react the fastest to every dip — they're the ones who understand their data well enough to know when to act and when to stay steady.
📊 Pro Tip
Use our Klaviyo Analytics Tool to pull your year-over-year performance trends side by side. Spot your seasonal patterns, set smarter benchmarks, and stop chasing problems that aren't there.
Analyze your seasonal trends →
No credit card required. Upload your Klaviyo export and see your full-year performance picture.